Flow Chart Insights
Flow Chart Insights turns your Job Tracker into a visual application funnel, helping you understand how applications are progressing through each stage of your job search.
Last updated 4 months ago
Flow Chart Insights gives you a high-level view of your job search directly from your Job Tracker.
The Flow Chart view helps you quickly understand how applications are progressing across each stage of your search, including where you're advancing and where applications are dropping off.
View your application funnel
Open your Job Tracker and switch to the Flow Chart view from the toggle in the top action row.
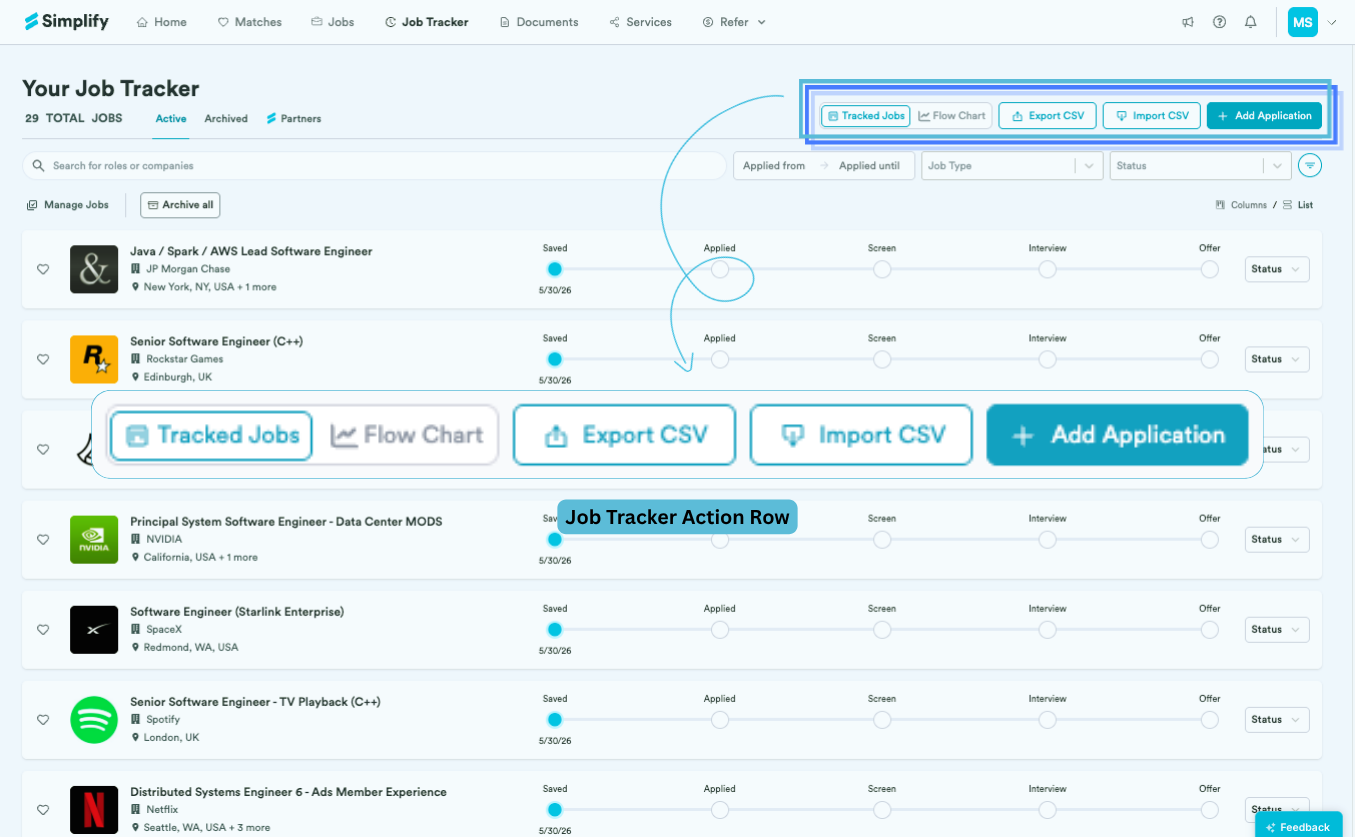
The chart highlights application insights like:
Total applications sent
Screens and interviews received
Offers received
Rejections
Applications with no response
✅ Good to know: As your application statuses change in the tracker, the Flow Chart updates automatically, making it easier to track how your search is progressing over time.
Save and share chart snapshots
You can save snapshots of your Flow Chart to analyze your job search. This can help you spot trends in your application funnel over time, including whether response rates, interview volume, or conversion rates are improving.
Saved charts can also be shared through a public link or exported as a PNG. Anyone with the shared link can view the chart, even without a Simplify account.
Was this helpful?
Still need help? Share an idea